The Empathy Index: A New Framework for Quantifying Human Connection
Dr Asma Qureshi
•
March 25, 2026


•
Empathy — the ability to understand and share the feelings of another — is the cornerstone of human-centered design and the first stage of any design-thinking process.
As a hands-on researcher, I’ve seen how empathy embedded into methods like prototype usability tests or diary studies conducted via WhatsApp unlock shared insights, lived experience, and the full spectrum of user emotion, from frustration and relief. It can change a design from something cold, transactional, or even hostile into something intuitive, respectful, and trustworthy.
One of my favorite examples I’ve seen is GE’s “Adventure Series” MRI. Seeing the machine through a child’s fearful eyes helped reimagine it as a child-friendly adventure — raising patient satisfaction by 90% while reducing anaesthesia rates.
A 2025 study from Zurich Insurance revealed that 74% of consumers avoid businesses that don’t show empathy. Despite the importance of empathy in business, empathy is too often dismissed as a “soft skill” rather than recognized as one of the most strategic capabilities an organization can build.
I think this is because empathy is genuinely hard to define, operationalize, and measure. Modern organizations live on metrics. And just as NPS measures loyalty, I’ve created an Empathy Index to fill this gap — a composite measure of how well a product or service resonates with users both emotionally and functionally.
Before exploring measurement, it’s worth being precise about what empathy actually is in a research context. Empathy is not a research method — it’s a research posture. It’s an attitude of curiosity, humility, and openness that shapes how you engage with users, interpret findings, and bring insights back to your team.
In practice, this posture shows up in a few specific ways. Personas and empathy maps humanize target users by capturing not just demographics but hopes, fears, and frustrations — inviting the design team to step into someone’s lived world rather than relying on assumptions. Journey maps extend this lens across time, surfacing the emotional highs and lows that define how a user feels about an entire experience. Participatory design goes further still, dissolving the researcher-participant divide by inviting users into ideation and prototyping directly.
These practices produce what I’d call research-based empathy: insights grounded not in imagination but in evidence of real human experience. The Empathy Index is a way to make that evidence durable inside organizations that run on numbers.
Askable gives you the platform, the participants, and the researchers to get there quickly.
Let's chatOne of the core challenges in measuring empathy is that it begins in stories, not numbers. Ethnographic research, remote interviews, and diary studies reveal recurring emotional themes: confusion during sign-up, relief after a successful transaction, and shame triggered by a poorly worded error message.
But these feelings can be translated into measurable survey items, behavioural proxies, and sentiment analysis.
My Empathy Index is not a single metric but a composite of user perception, behavioral data, and expert evaluation — represented on a 0-100 scale.
I recommend weighing the score as follows:
You can customize your Empathy Index to reflect your product’s specific context, but I’d strongly recommend keeping core survey questions and evaluation criteria consistent across products. Standardization is what allows you to benchmark, identify best practices, and create feedback loops for iterative improvement. Domain- or culturally-specific nuances can always be layered on top.
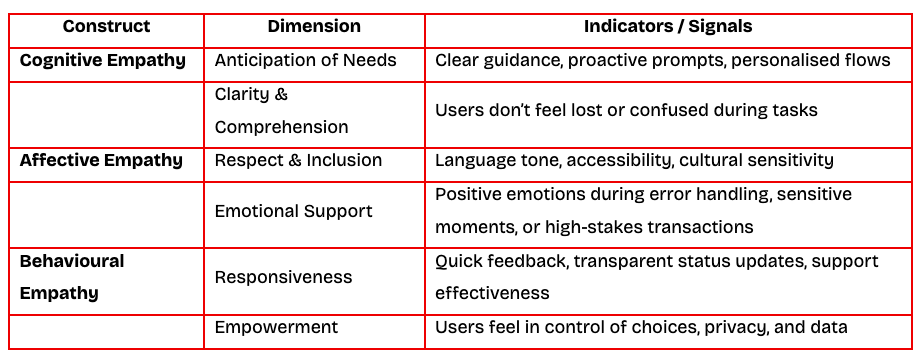
Create your survey using a 5-point Likert opinion scale (Strongly Disagree to Strongly Agree). I recommend structuring questions across three constructs of empathy–Cognitive, Affective, and Behavioral–each pointing to distinct, measurable outcomes.
Get a sneak peek into the product, and everything Askable can do for you.
Contact salesTo avoid oversimplifying empathy —and to prevent metric fatigue for both users and teams—your Empathy Index score must be paired with real stories. Adding one or two open-answer questions to your survey surfaces the quotes, narratives and observations from participants that humanize the number. It also guards against “gaming” the metric through cosmetic fixes that raise scores without addressing root issues.
Sample open-ended items:
You also can also analyze reviews, support tickets, and user feedback for emotional tone — coding for recurring signals of frustration, confusion, or delight.
Behavioral analytics can surface unmet emotional needs that users may not articulate directly:
Empathy is hard to keep alive in product teams for the same reason it’s hard to keep alive in any system: it’s rarely the thing that gets measured, reviewed, and refreshed. So even when a team genuinely cares, “empathy” gets treated like a principle, not a practice.
An Empathy Index is one way to turn it into a practice. Not by pretending a number can replace a story, but by creating a repeatable loop: collect the stories, translate them into consistent signals, and revisit them often enough that they can actually influence what ships.
And new technologies have made major strides in keeping that loop running. AI-enabled research workflows mean teams can refresh those signals continuously, or have then automatically on-demand—so empathy doesn’t show up only in a kickoff workshop or a quarterly report. It shows up where it matters: ready for the next decision, not after.

.svg)